Demand Signal Explorer — Catalyst Lab Portal
Data Engineer · International Water Management Institute (IWMI) · 2025
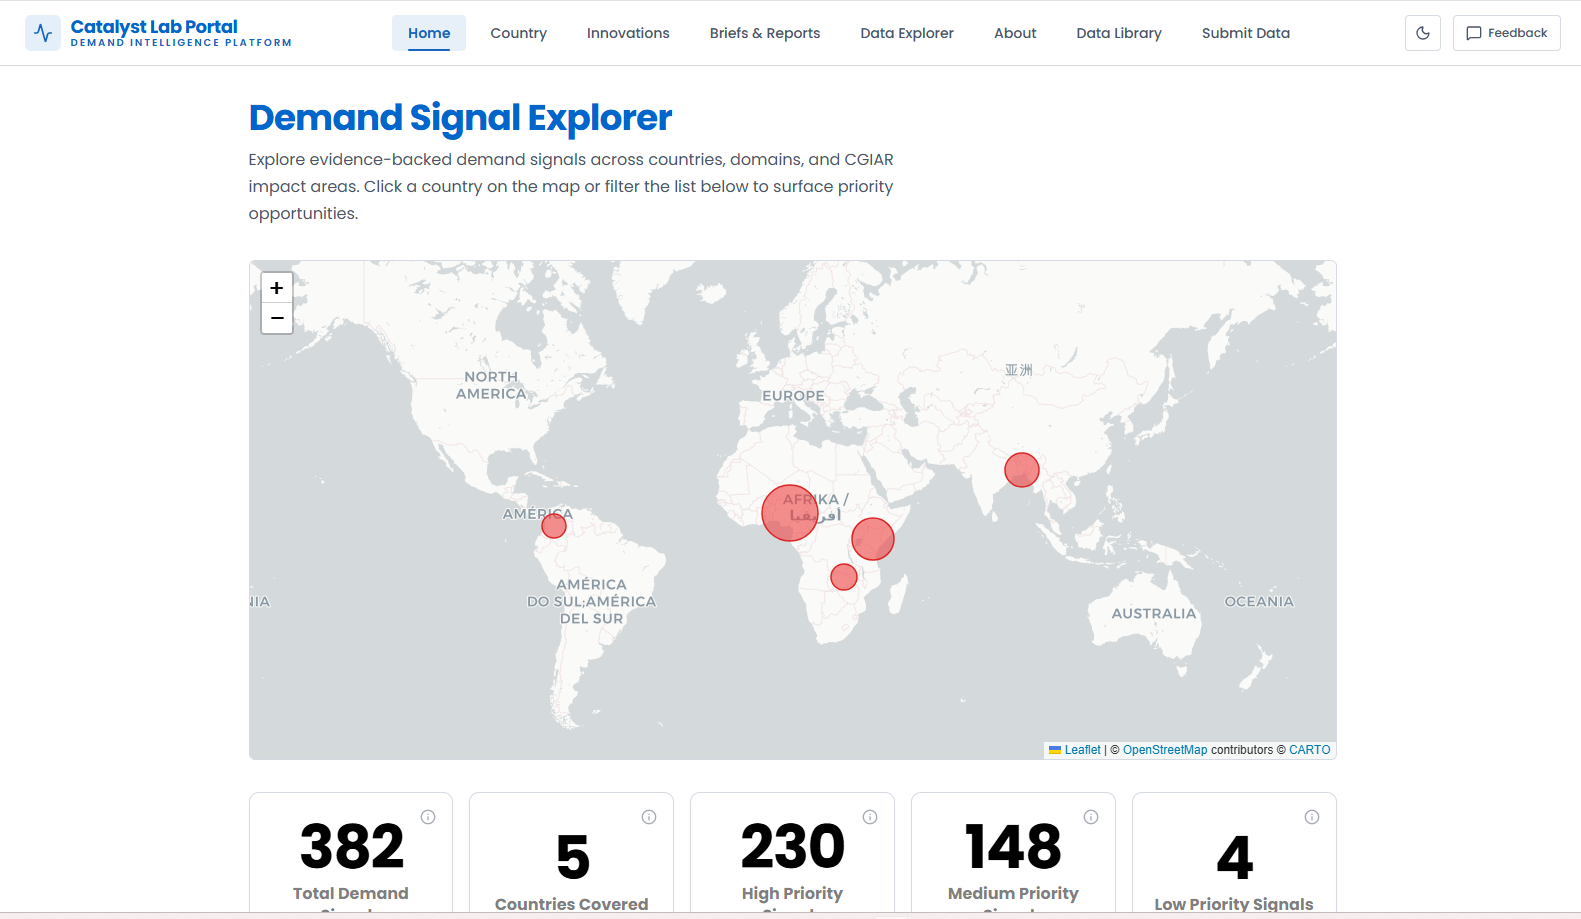
The Catalyst Lab Portal turns scattered policy documents and secondary data into evidence-backed demand signals that CGIAR Centers and the Science Program Accelerator can actually act on. I built the data engineering and AI layer that produces those signals, and the explorer that makes them navigable.
The problem
Demand for agricultural research doesn't arrive as a dataset. It's buried in national policy documents, strategy papers, government reports, NGO assessments, and publications from international organisations — thousands of pages, in different formats, across many countries. Someone deciding where to direct a research programme had no way to see that demand as evidence, only as anecdote.
Harvesting the sources
I built the ingestion layer that harvests secondary data from across that landscape — governments, NGOs, and international organisations — and normalises wildly different document and data formats into one consistent structure. Each source keeps its provenance, so every signal downstream can be traced back to the document it came from.
Extracting demand signals with AI
The core of the system is the extraction pipeline. Rather than keyword search, it uses AI to read policy and programme documents and pull out demand signals — concrete statements of need — then enriches each one with the country, domain, and CGIAR impact area it belongs to, and scores it by priority. That turns unstructured text into a queryable evidence base of 380+ signals across the covered countries, classified into high, medium, and low priority.
Making it explorable
Evidence nobody can navigate is evidence nobody uses. The explorer puts the signals on an interactive map where each country is scaled by signal volume, so the geography of demand is visible at a glance, with filtering by domain and CGIAR impact area underneath. Click a country and you drill from the continental view into that country's specific signals, each one linked back to its source.
The wider portal
The explorer sits inside the Catalyst Lab Portal alongside country profiles, innovations, briefs and reports, a data explorer, and a data library — with a submission route so the evidence base keeps growing rather than going stale after launch.