Envirotrust — Pan-European Climate Risk Platform
Geospatial Data Engineer · Envirotrust, Germany · June 2025 - Present
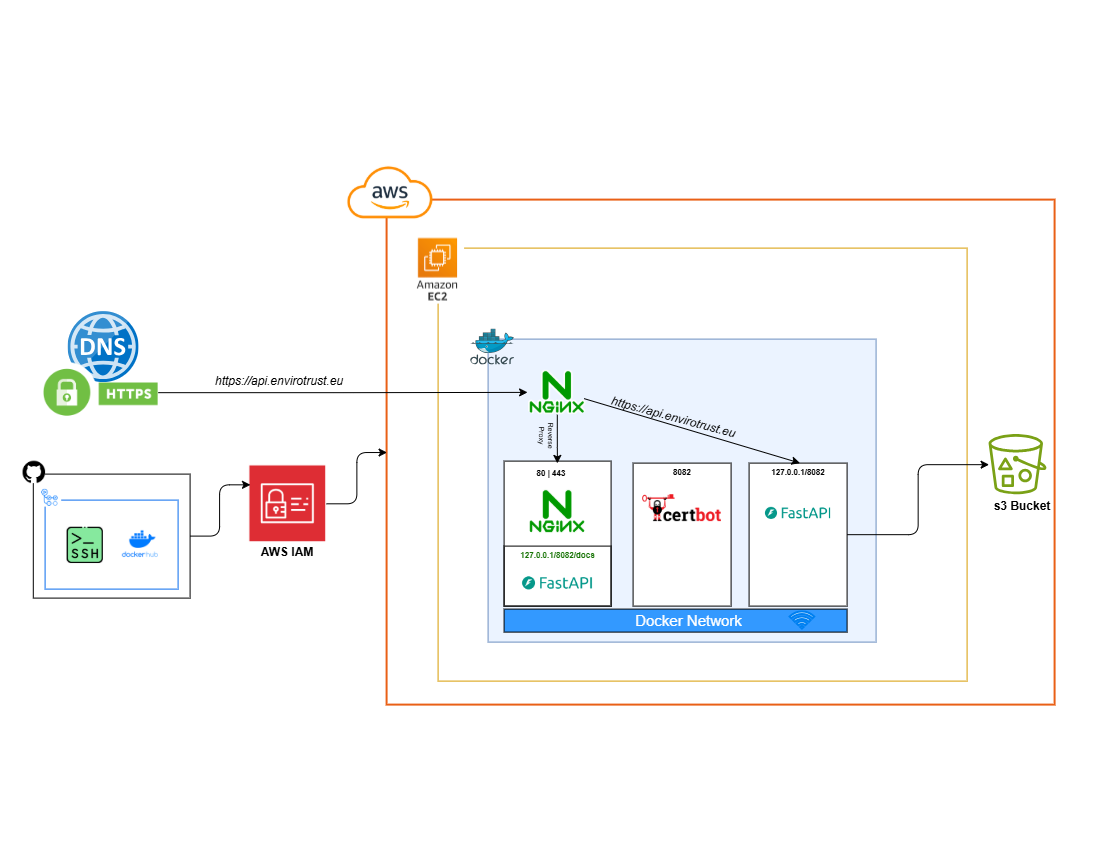
Envirotrust models wildfire, flood, heat, and wind risk across Europe. The product people see is a map; the part that makes it possible is the data engineering underneath it. As the data engineer on the project, these were mine to decide.
What the raw data actually looks like
The inputs are nothing like a clean dataset. Climate variables arrive as long NetCDF time series; regional flood and hazard data comes from separate authorities across the German federal states, each publishing on its own schedule; and individual sources run to 20, 30, 40 GB apiece. Every provider uses its own projection, its own spatial resolution, and its own conventions, and the climate data multiplies again across RCP scenarios, so the same variable exists several times over for different emissions pathways.
Before any of it can be modelled it has to be made comparable. I built the harmonisation layer that reprojects and resamples every source onto one common grid using GDAL/OGR, aligns the time axes, and rewrites the lot into a single standardised format the rest of the system can assume. Getting this right is most of the job — a risk model that silently mixes projections produces confident, wrong answers.
Choosing the storage formats
Climate and hazard data arrives as huge multi-dimensional rasters and long tabular histories, and loading it into a conventional spatial database would have meant paying for a large always-on server just to answer a map request. I standardised on cloud-native formats instead — Zarr for the multi-dimensional climate cubes, COG for the imagery and hazard layers, and Parquet for the tabular side. All three are readable directly from object storage by byte range, so a request pulls only the chunk it needs rather than the whole file.
That meant a conversion pass over everything. The NetCDF time series were rewritten to Zarr and deliberately chunked along the axes the API actually queries, so a request for one location over one time window reads a handful of chunks instead of opening a 40 GB file. Rasters became COGs with overviews, and the vector side — including some very large shapefiles — was converted to Parquet. Everything is then read lazily: the pipeline describes the computation first and only pulls the bytes it needs when the result is actually requested, which is what makes 40 GB sources workable without a 40 GB machine.
Query and processing layer
On top of that I used Xarray for the gridded work and DuckDB for the tabular analytics — DuckDB reads Parquet on S3 in place, which removed a whole database tier from the architecture and kept aggregations fast without anything to provision or keep warm.
The API
I built the backend in FastAPI: async by default, which matters when most request time is spent waiting on object storage, and typed request and response models that generate their own OpenAPI docs, so the frontend team could work against a contract instead of against me. Titiler sits alongside it to tile the COGs on the fly, so no pre-rendered tile pyramids ever have to be generated or stored.
The endpoint lets property owners and real estate professionals pass a location and instantly get back the climate risk attached to that land or property — wildfire, flood, heat, and wind — turning the whole pipeline into a single question a non-technical user can ask.
I also built the authentication layer around it, so access is controlled and requests are attributable rather than the API sitting open to anyone who finds the URL.
Infrastructure and delivery
Everything is containerised with Docker and runs on AWS — S3 for the data lake, Lambda for spiky per-request work, EC2 for the sustained pipeline jobs. I set up the GitHub Actions CI/CD so tests, image builds, and deployment run on every merge; with a distributed remote team, making deployment boring was worth more than any individual optimisation.
Ingestion pipelines
The pipelines source and harmonise hazard and climate data from many providers, each with its own projection, resolution, and update cadence, and aggregate it to the risk parameters the scenario models actually consume. The aggregation strategy was designed around minimising what has to move to the cloud — reduce early, transfer little, model fast.
Run end to end, that turns tens of gigabytes of mismatched NetCDF, shapefiles, and rasters from separate authorities into one queryable, analysis-ready layer that answers a location request in the time it takes a map to pan.